Click here to download a printer FMC-C&W- 9-22-26-Final friendly (pdf) version
CROP AND WEATHER REPORT
For the Monthly Report Ending September 24, 2026
GENERAL COMMENTS & WEATHER: September 22nd is the official start of the fall season, but here in Southwestern Minnesota (SWMN), it doesn’t seem like it, as harvest has barely started. The weather since our last Crop & Weather Report (July 15th) through Labor Day weekend had been dry, with drought conditions throughout much of the area. Since then, we have received several nice rainfalls, but as many farmers have stated, it is about 45 days too late. The Southwestern Minnesota Research and Outreach Center (SWROC) in Lamberton only recorded 2.64 inches of rain from July 15th to September 15th. On September 1st, the subsurface moisture was at 1.17 inches. The soil has not been that deficient in moisture since 2021 and is currently 3 inches below the historic average. The dry conditions have been hard on corn and soybean plants, but high humidity levels have helped maintain some plant health. There are areas that received higher rainfall totals than others, as indicated in more detail at the end of this report.
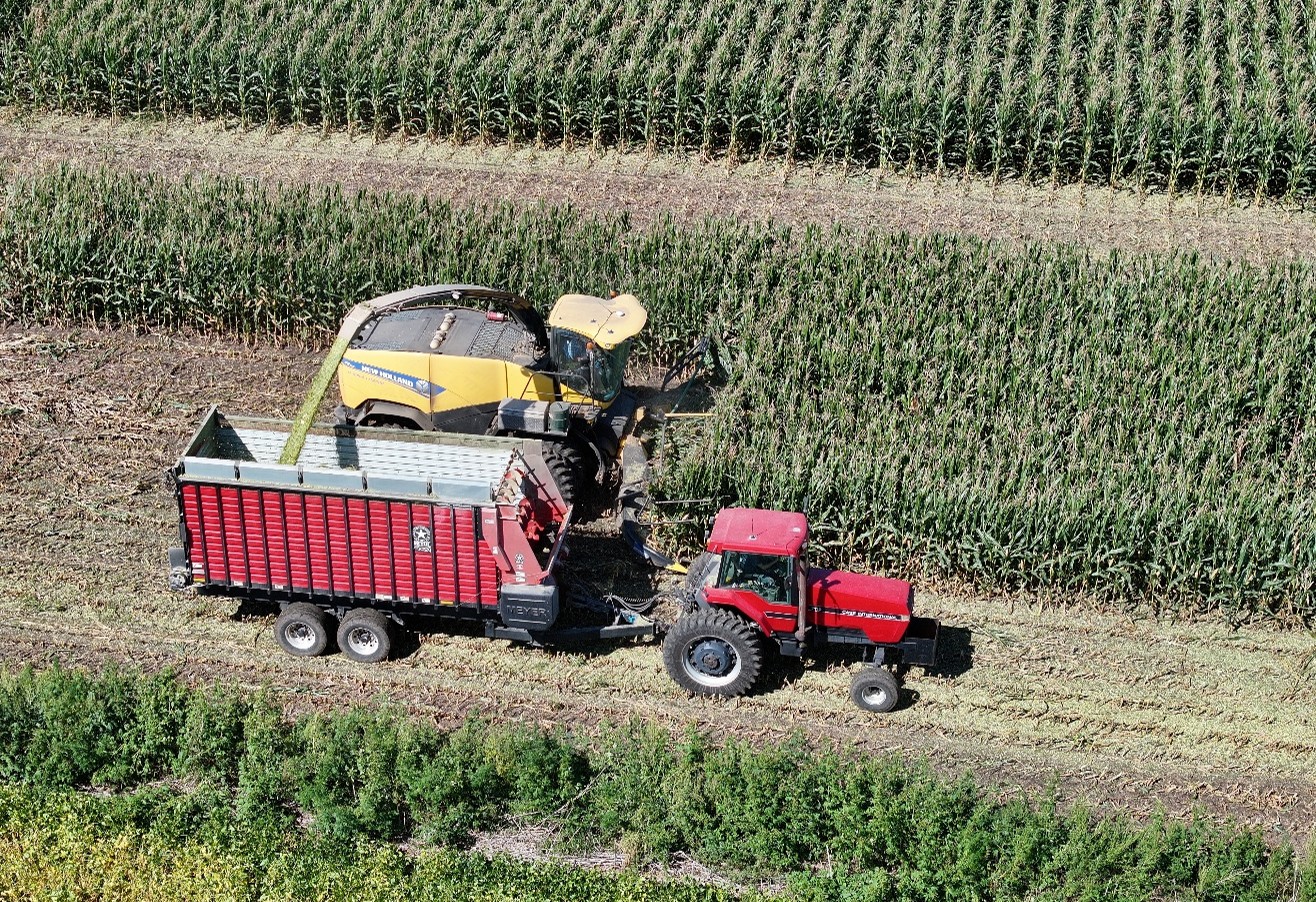 Figure 1 – Silage harvest was completed at the beginning of September. Silage is when the whole corn plant is chopped up, hauled in wagons, piled up, and then used for cattle feed.
Daily high temperatures stayed in the mid to upper 80 degrees from the end of July through the start of September, with daily lows in the low to mid-60s. It cooled off recently and has started to feel like Fall. The past ten days had highs ranging from 61 to 75 degrees and lows from 47 to 61 degrees. Growing Degree Days (GDD) are significantly above the historic average at the SWROC. We are currently at 2,665 GDDs, which is 206 units above the historic average. This is not surprising given the lack of rainfall most of the growing season, as there have been more clear days with higher temps, which equates to more GDDs. With rain last Friday (9/18) and Sunday (9/20), and more in the forecast this coming week, we expect there to be a delay for farmers to really get going with harvest. With the full range of weather on display this growing season, we are anxiously awaiting to see the crop yields this year.
SOYBEANS: Since our July report, we have scouted for aphids and found that the dry conditions thankfully kept their populations in check and so we did not have to apply an insecticide on most of our fields this year. As previously mentioned, a couple of soybean fields have already been harvested. Early maturity seed varieties and fields that were planted ahead of the corn this spring have reached maturity and were ready to be harvested by the middle of September. Later maturities and fields with later planting dates still have some color left on the leaves, and it will be another week or two before they are ready. Early yield reports have been sporadic ranging from 45-70 bushels per acre. Geography and soil type will be the determining factors in soybean production this year. We do anticipate better than average soybean yields across most of SWMN this harvest.
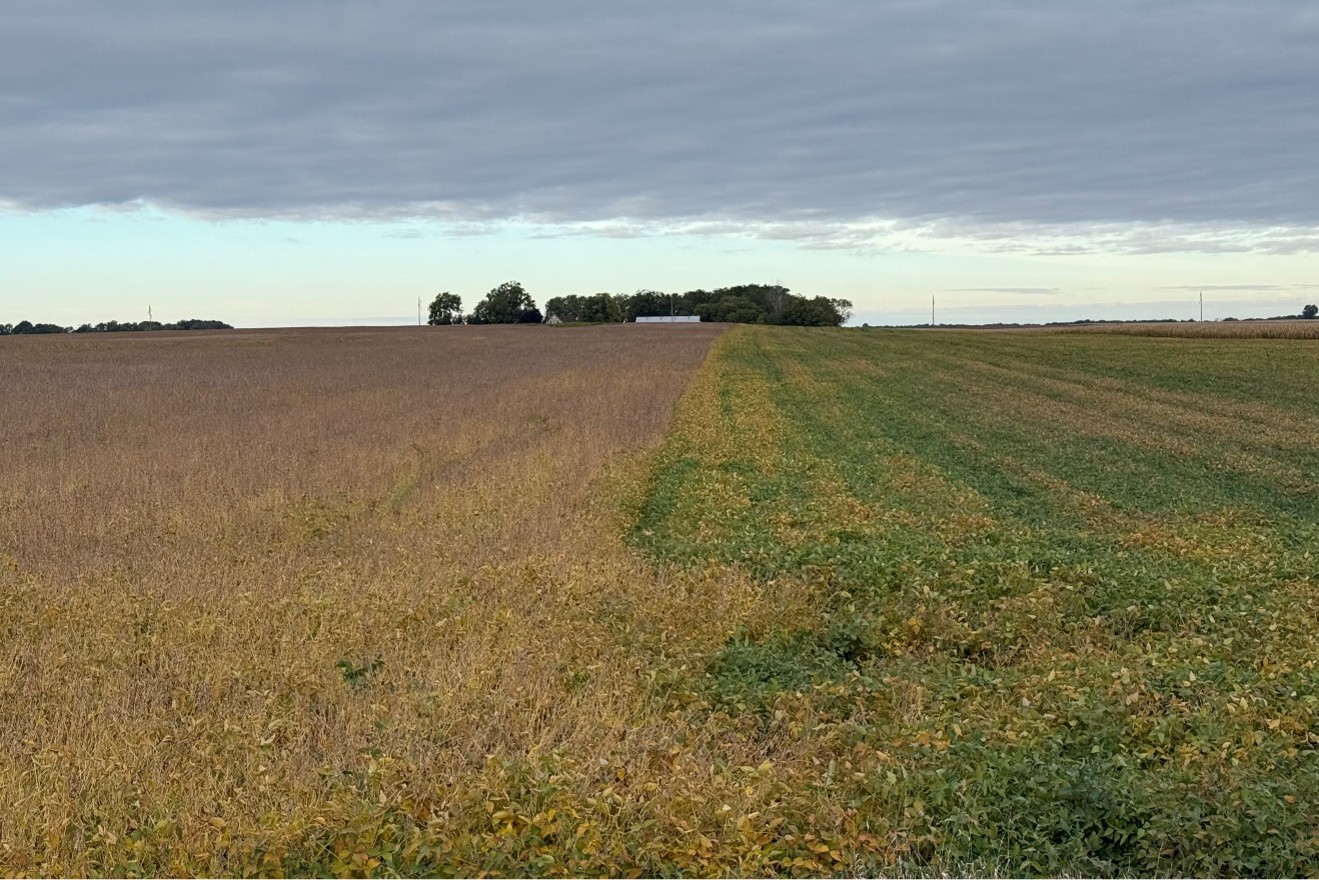 Figure 2 – The difference in soybean maturity and planting dates is very visible at this point in the year. The field on the left is about ready to be harvested, and the field on the right still needs more time.
Nationally, the soybean crop is rated as 58% good to excellent, which is down from 61% a year ago. In Minnesota, soybeans are rated as 59% good to excellent. Minnesota soybeans are also 8% harvested compared to 3% at this time last year. In the Monthly USDA Supply & Demand Report released on September 11th, the USDA has projected the national soybean yield at 52.8 bushels per acre, down one bushel per acre from last year. The projected ending national carryout (inventory) for the 2026 crop is estimated to be 310 million bushels.
CORN: The corn crop looks more variable than it was last year. Lack of moisture at a critical time in ear development will have some effect on final yields. The fields we scouted this summer looked great from the road/air, but when you pulled the husk off, the ear was smaller than expected. Also, while scouting we were looking for diseases such as Tar Spot and Southern Rust. Thankfully the dry conditions were not conducive for disease development this year, so fungicide was applied sparingly this growing season. Unfortunately, the drought created another problem, corn cannibalization. This is where the corn plant takes nutrients and energy away from its own roots to try to put into the developing kernels. The lack of water limits how many nutrients the plants could uptake from the soil so it essentially cannibalizes itself, creating very weak stalks that can be susceptible to wind damage. We are monitoring fields and will prioritize harvesting any that are at risk, because once the ear drops to the ground, it is no longer harvestable. Some operators have harvested a few corn fields, but we do not have any reported yields at this time. Yields are expected to be down from last year, which is not surprising given the record breaking corn crop we had in 2025.
The national corn crop is rated at 57% good to excellent, which is down 9% from this time last year. In the monthly USDA Supply & Demand Report released on September 11th, the average national corn yield was estimated to be 178.5 bushels per acre, which is down 2.2 bushels per acre from the previous month’s report. This is also down about 8 bushels from the 2025 corn crop. The crop ratings and estimated national yields are one reason corn prices have increased this summer.
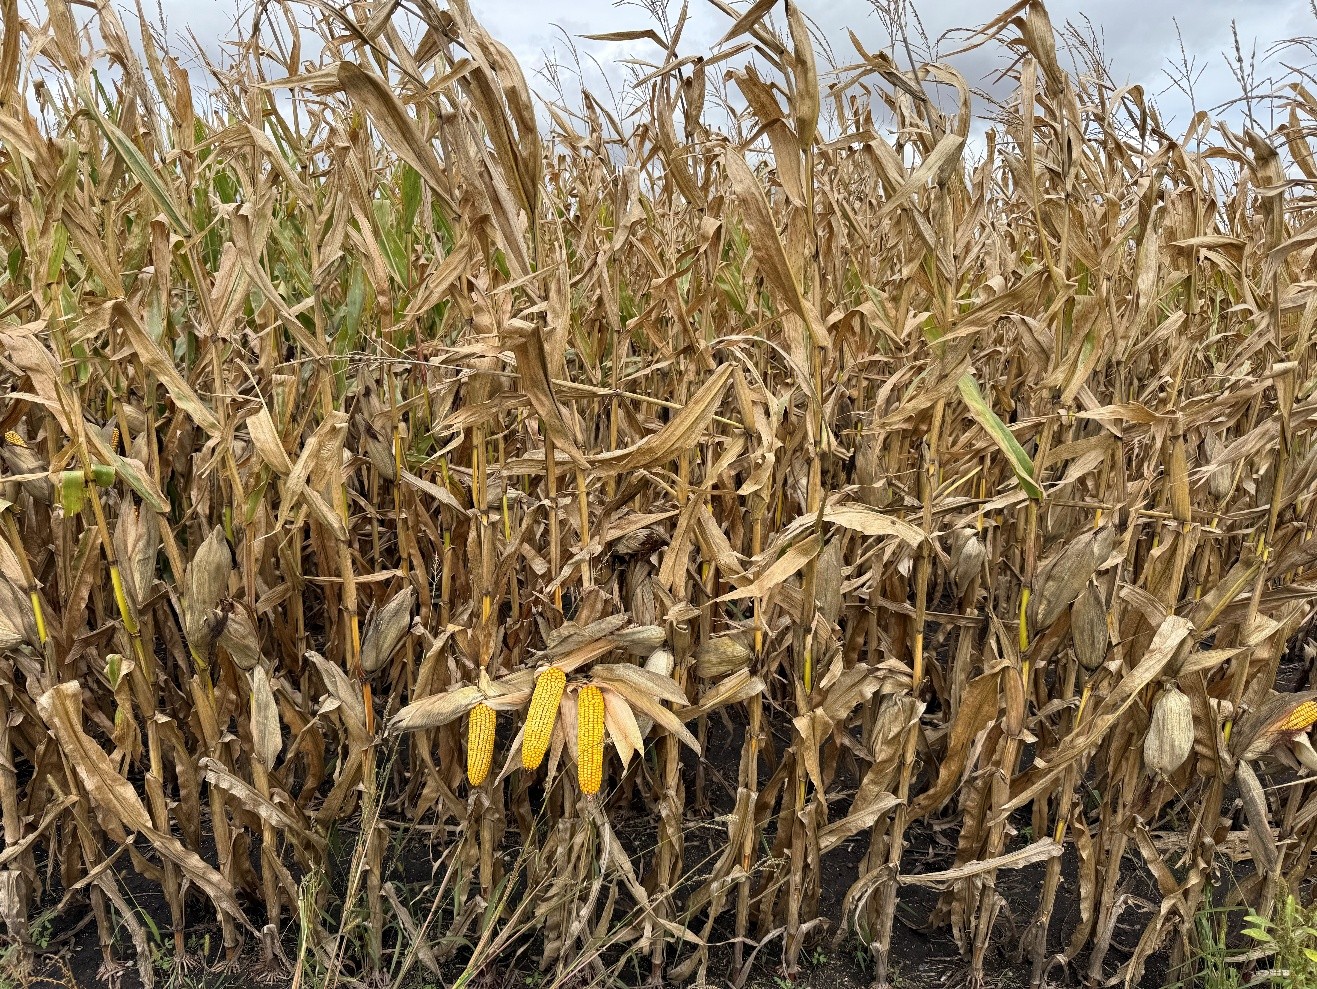 Figure 3 – Some good-looking corn in Jackson County. You can see the stalks are weaker as the tops have been knocked off of a lot of the surrounding plants by wind.
REMARKS: The grain markets have rebounded nicely since the lows that were set at the end of June. Soybean prices were at $10.60/bushel for cash and harvest delivery and are now around $12.75/bushel. Cash corn prices were as low as $3.70/bushel at the end of June and now are $4.90/bushel and about $5.15/bushel into January 2027. Corn and soybean prices are currently at $4.75/bushel and $12.00/bushel, respectively for the 2027 crop.
With grain prices up significantly from last year, it’s expected that it will be high enough to offset any potential decrease in yields. That being said, farmers are hoping to see relief from high input costs, particularly diesel fuel and fertilizer. Diesel fuel has hit an all-time high in SWMN as well and is coming at a bad time, right when producers use the most fuel. Combines, grain cart tractors, semi-trucks, fertilizer applicators and tenders, and tillage tractors all consume a great deal of diesel fuel in the fall. Some producers were able to lock in fuel a dollar or so cheaper than today, but it is still almost $3 per gallon higher than it was this winter. Fertilizer costs are up from last year as well, particularly phosphates. That being said, potash (the source for potassium) is actually reasonably priced, especially considering the price of corn. Although fertilizer prices are up $25+ per acre more than last fall, it could be worse based on the situation in the Middle East.
We await news of a new Farm Bill. The Bill has passed the House and is working its way through the Senate committees. One of the biggest components of the new bill would be allowing year-round ethanol (E-15) which would significantly increase the demand for corn nationally. The Farm Bill has not been updated since 2018.
At the Fairland office, we are coordinating harvest and fall fertilizer plans with our tenants. We are wrapping up crop input billing, doing financial projections, recently completed estimated tax payments, working on various projects in the fields, and preparing for year-end. There are several Mid-Contract Maintenance (MCM) practices (i.e. mowing) in land that is enrolled into the Conservation Reserve Program (CRP) that are required by FSA to be completed by September 30th. We are also working on several wind/solar projects and a large, proposed transmission line through SWMN. Fairland is also assisting some clients with estates and estate planning. It is a busy time of the year, but always an exciting time when we get into harvest and see how the crop yields turn out.
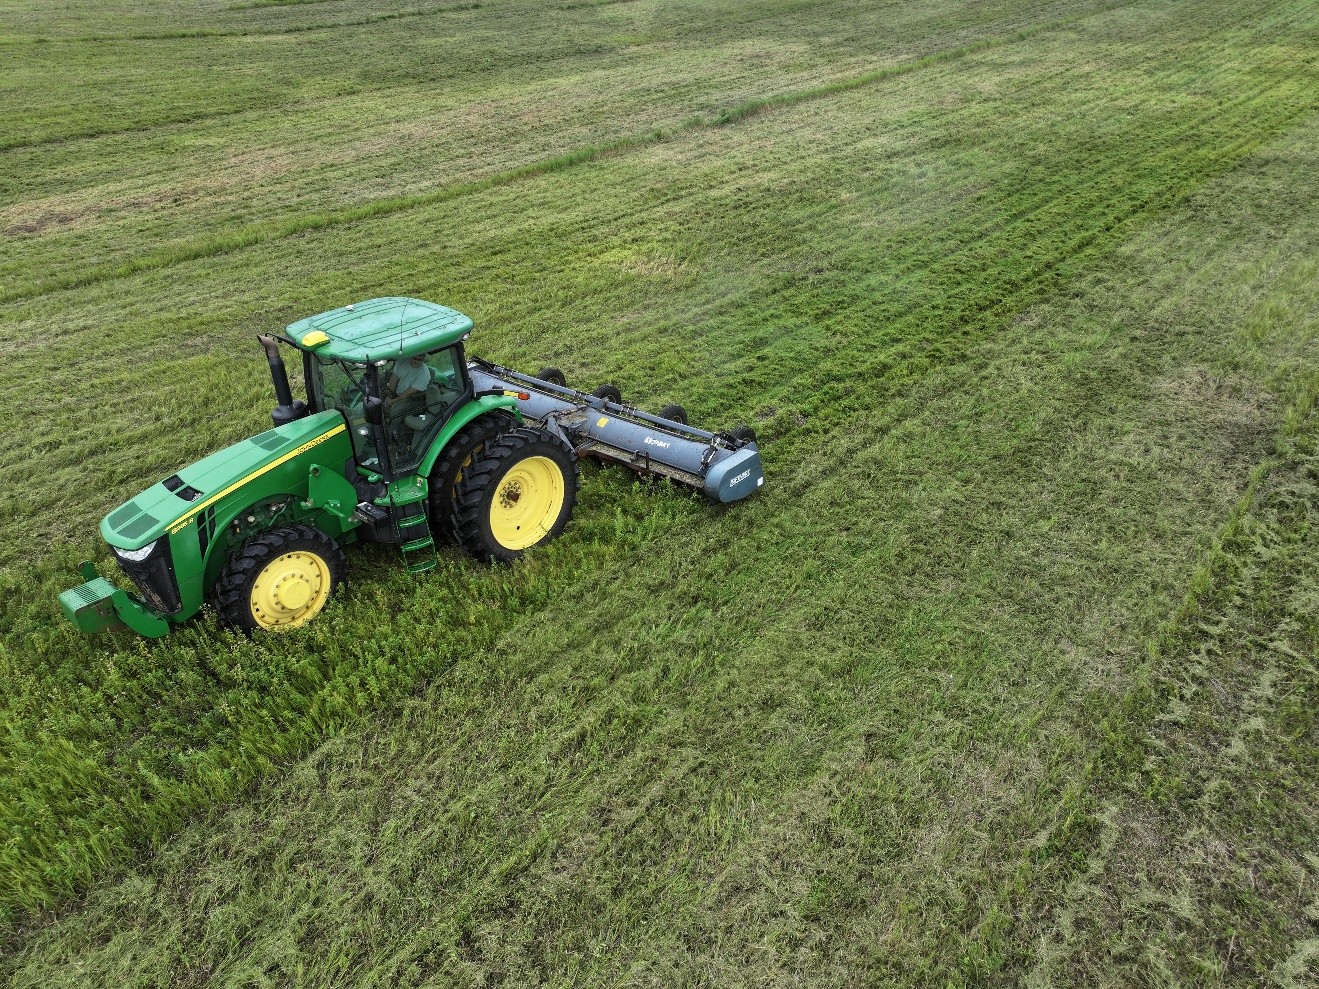 Figure 4 – Here a farm operator is mowing some CRP acres to complete the Mid-Contract Maintenance that is required around the middle of the contract.
Growing-Degree Days
| May 1, 2026 to DATE INDICATED | TOTAL GROWING DEGREE DAYS | DEPARTURE FROM NORMAL | |
| LOCATION Lamberton |
September 24, 2026 | 2600 | +217 |
Corn Growing Degree Days are calculated by subtracting a 50 degree base temperature from the average of the maximum and minimum temperature for the day. The daily maximum is limited to 86 degrees and the minimum is 50 degrees.
Grain Markets (September 23, 2026)
| New Vision-Windom | Magnolia | POET Ethanol-Bingham Lake | Minnesota Soybean Processors- Brewster | |
| Cash-Corn | $4.89 | $4.73 | $4.74 | N/A |
| Cash-Soybeans | $12.60 | $12.73 | N/A | $13.68 |
| October-Corn | $4.77 | $4.73 | $4.77 | N/A |
| October-Soybeans | $12.60 | $12.73 | N/A | $13.03 |
Rainfall (Inches):
| County | City | July 16 – September 22, 2026 | March 15 to date-2026 | March 15 to date-2025 |
| Cottonwood | Jeffers | 5.7 | 18.7 | 27.6 |
| Cottonwood | Windom | 6.7 | 22.8 | 25.7 |
| Jackson | Heron Lake | 8.8 | 24.5 | 24.3 |
| Jackson | Jackson |
11.9 |
27.8 | 24.8 |
| Martin | Trimont | 9.6 | 25.1 | 29.7 |
| Murray | Fulda | 7.5 | 23.0 | 23.4 |
| Murray | Slayton |
6.9 |
16.4 | 25.0 |
| Nobles | Round Lake | 8.7 | 20.9 | 27.2 |
| Nobles | Rushmore | 10.5 | 23.4 | 27.1 |
| Rock | Magnolia | 7.2 | 16.8 | 24.4 |
| Watonwan | Darfur | 6.2 | 17.5 | 23.8 |
Cody I. Adrian
Farm Management Advisor
Real Estate Salesperson